Who?
OneLog is the joint login of the Swiss Digital Alliance, the merger of the largest Swiss media and publishing houses as Ringier (Axel Springer Schweiz) and TX Group (known as Tamedia). OneLog offers single sign-on solution for brands like 20 Minuten, Blick, Tagesanzeiger, Beobachter, Sonntagszeitung, Schweizer Illustrierte and many more.
What did I do?
I was there for 3 months part-time to create a new concept for (1) a landing page and (2) a responsive KPI dashboard for all brands, among other smaller tasks. I worked in an agile team with developers, another UX designer and a CTO and CEO.
(1) Concept and Design for the new Landing Page

The current Landing Page needed to be refined (Link to current Landing Page) because
A There is no clear navigation so the user knows where to find the information they need
B It didn't let the user know what OneLog is doing
C It wasn't clear where the User can use OneLog
D It wasn't clear how it works
E There were no FAQ's
F It is very text-heavy and the User most likely is not interested in reading through it
Goal Create a product informational landing page that easily explains to the user what OneLog does, how it works, and where to find the information they need.
Problem Definition Onelog is a B2B solution, which is why it doesn't need any marketing and doesn't have to be too brand-heavy, but should still create recognition value.
Idea clear information architecture. What information does the user need first?
USP Authentic, informative but not boring.
Scribbles Landing Page
Preview
Mobile Landing Page
Information Architecture
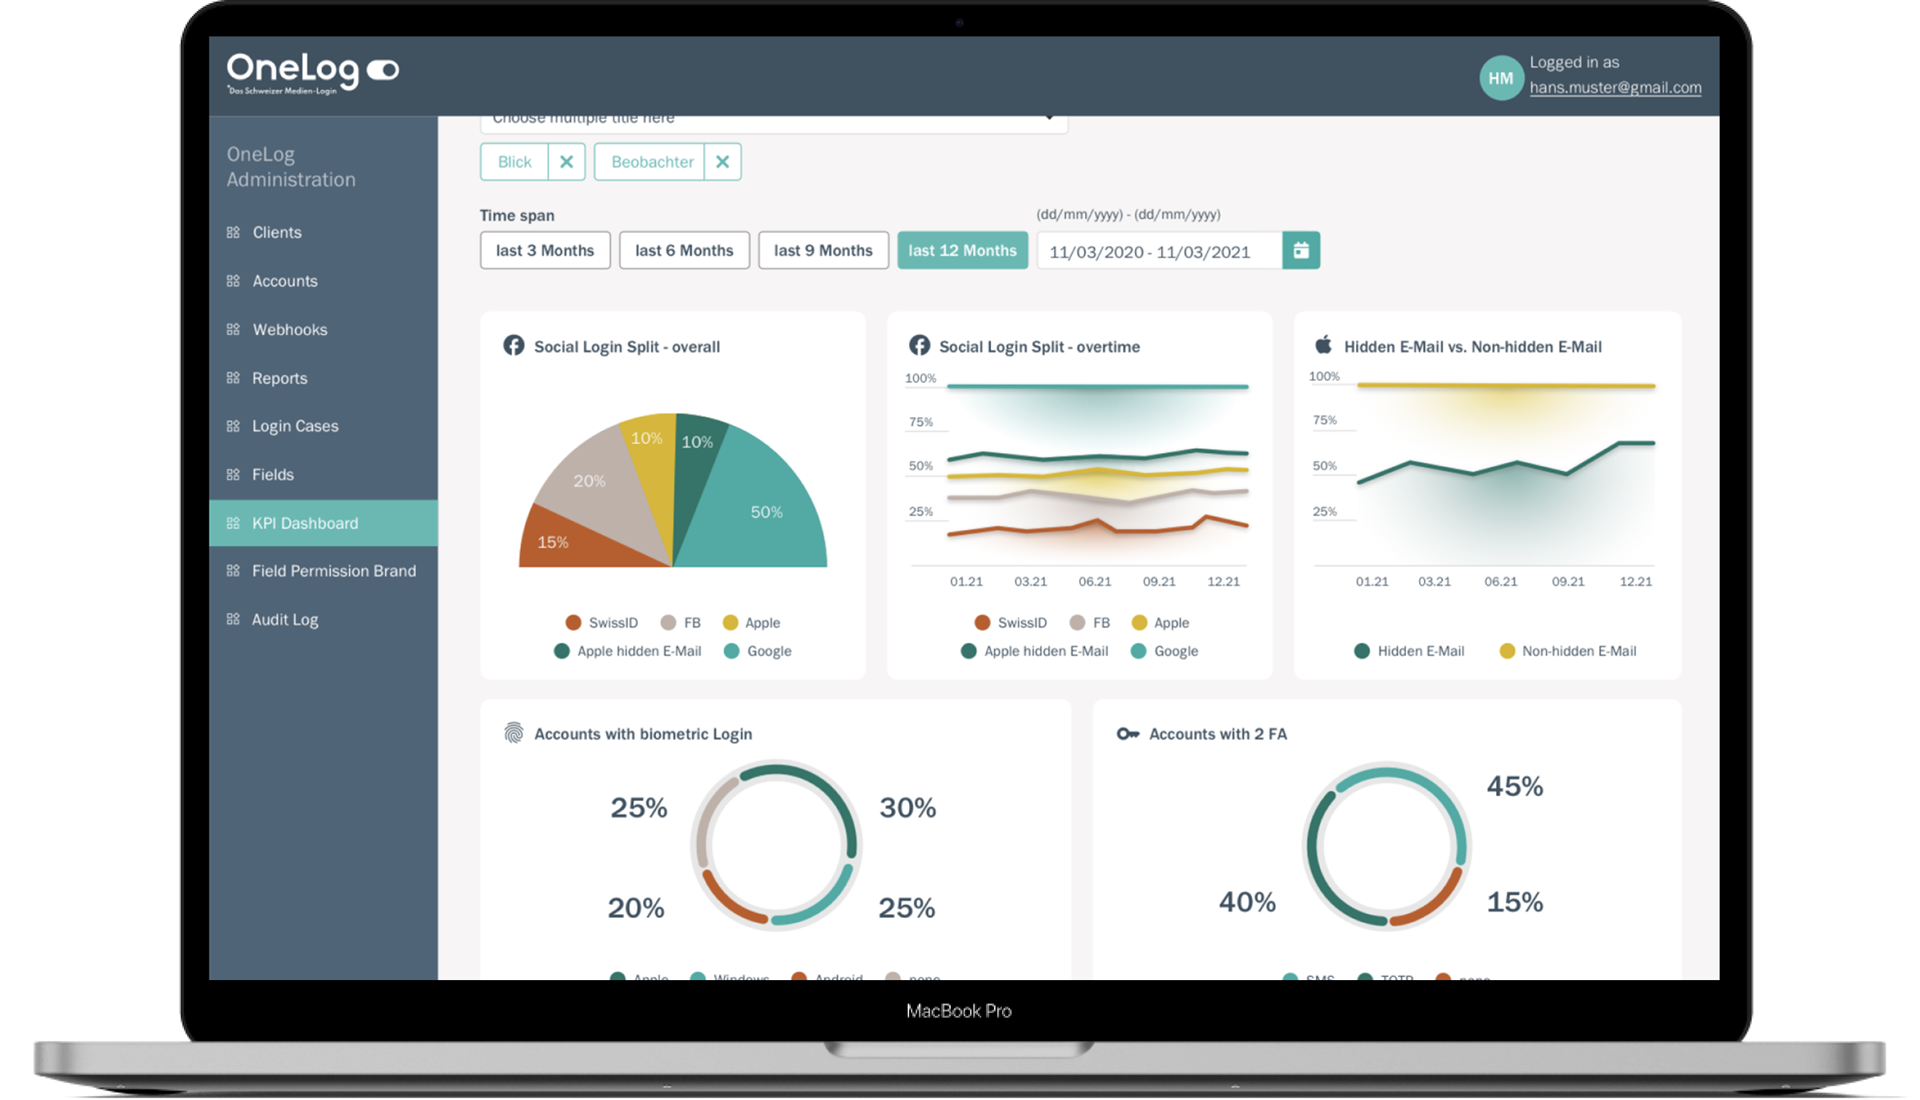
(2) Concept & Design for responsive KPI Dashboard
The way to track OneLog's performance was to use Excel. It wasn't user friendly and not practical when you want to change data to see the different results.The solution should be easy to use and also show stakeholders the benefits of implementing OneLog in their brand.
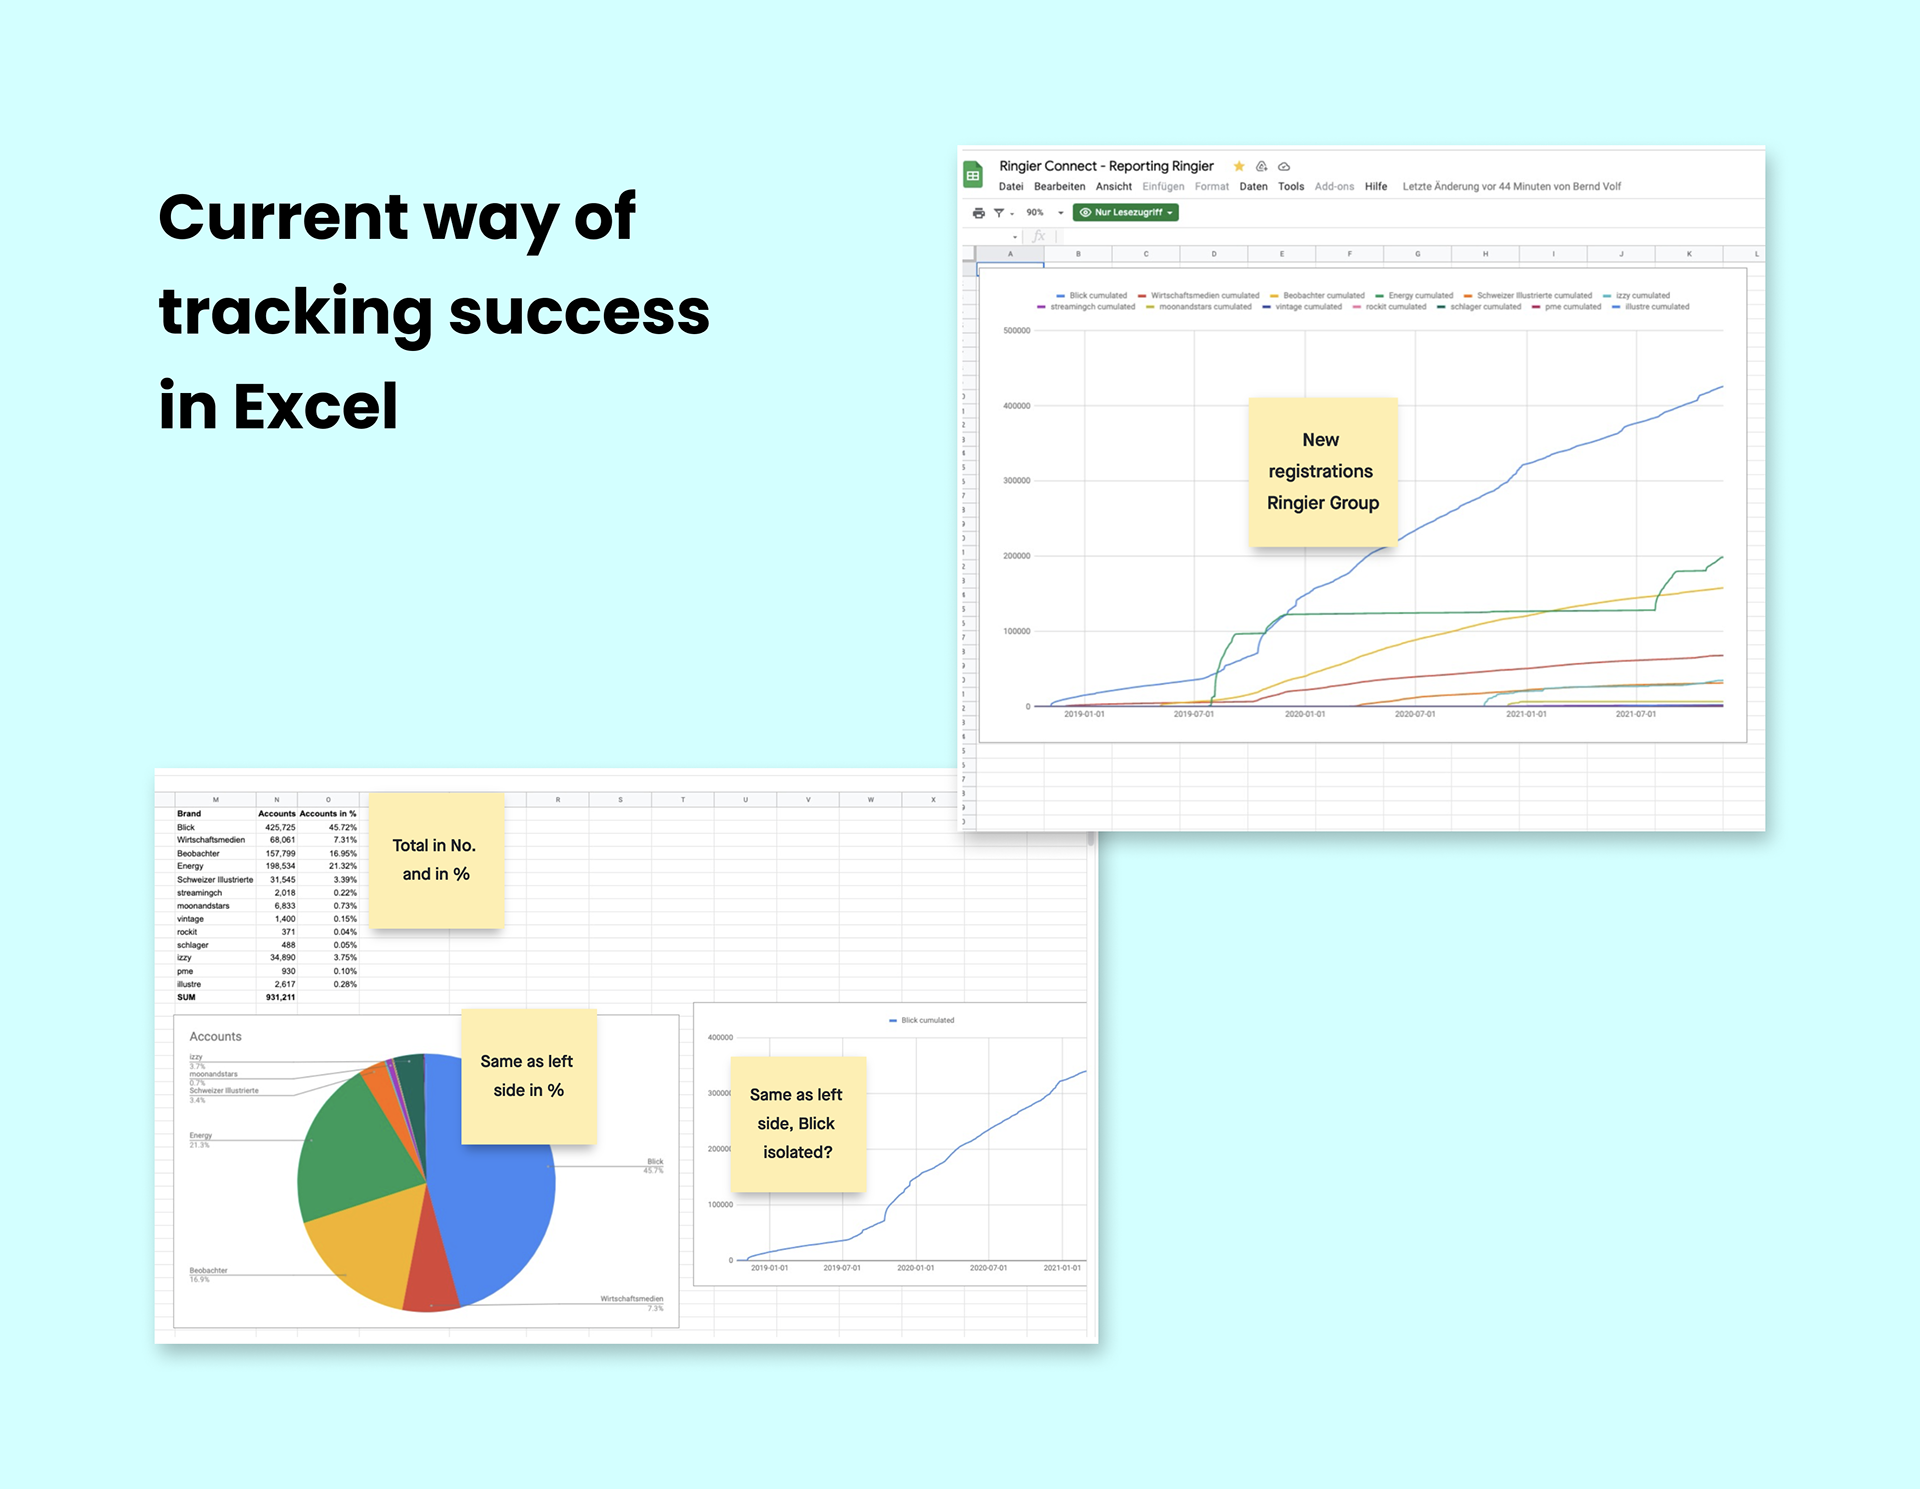
Goal Create a KPI dashboard that can be used on both a desktop and mobile screen.
Problem Definition The data should be accessible, easy to understand, and clearly present to stakeholders the benefits of using OneLog and help identify problems, such as when there is a sudden increase in the number of deleted accounts.
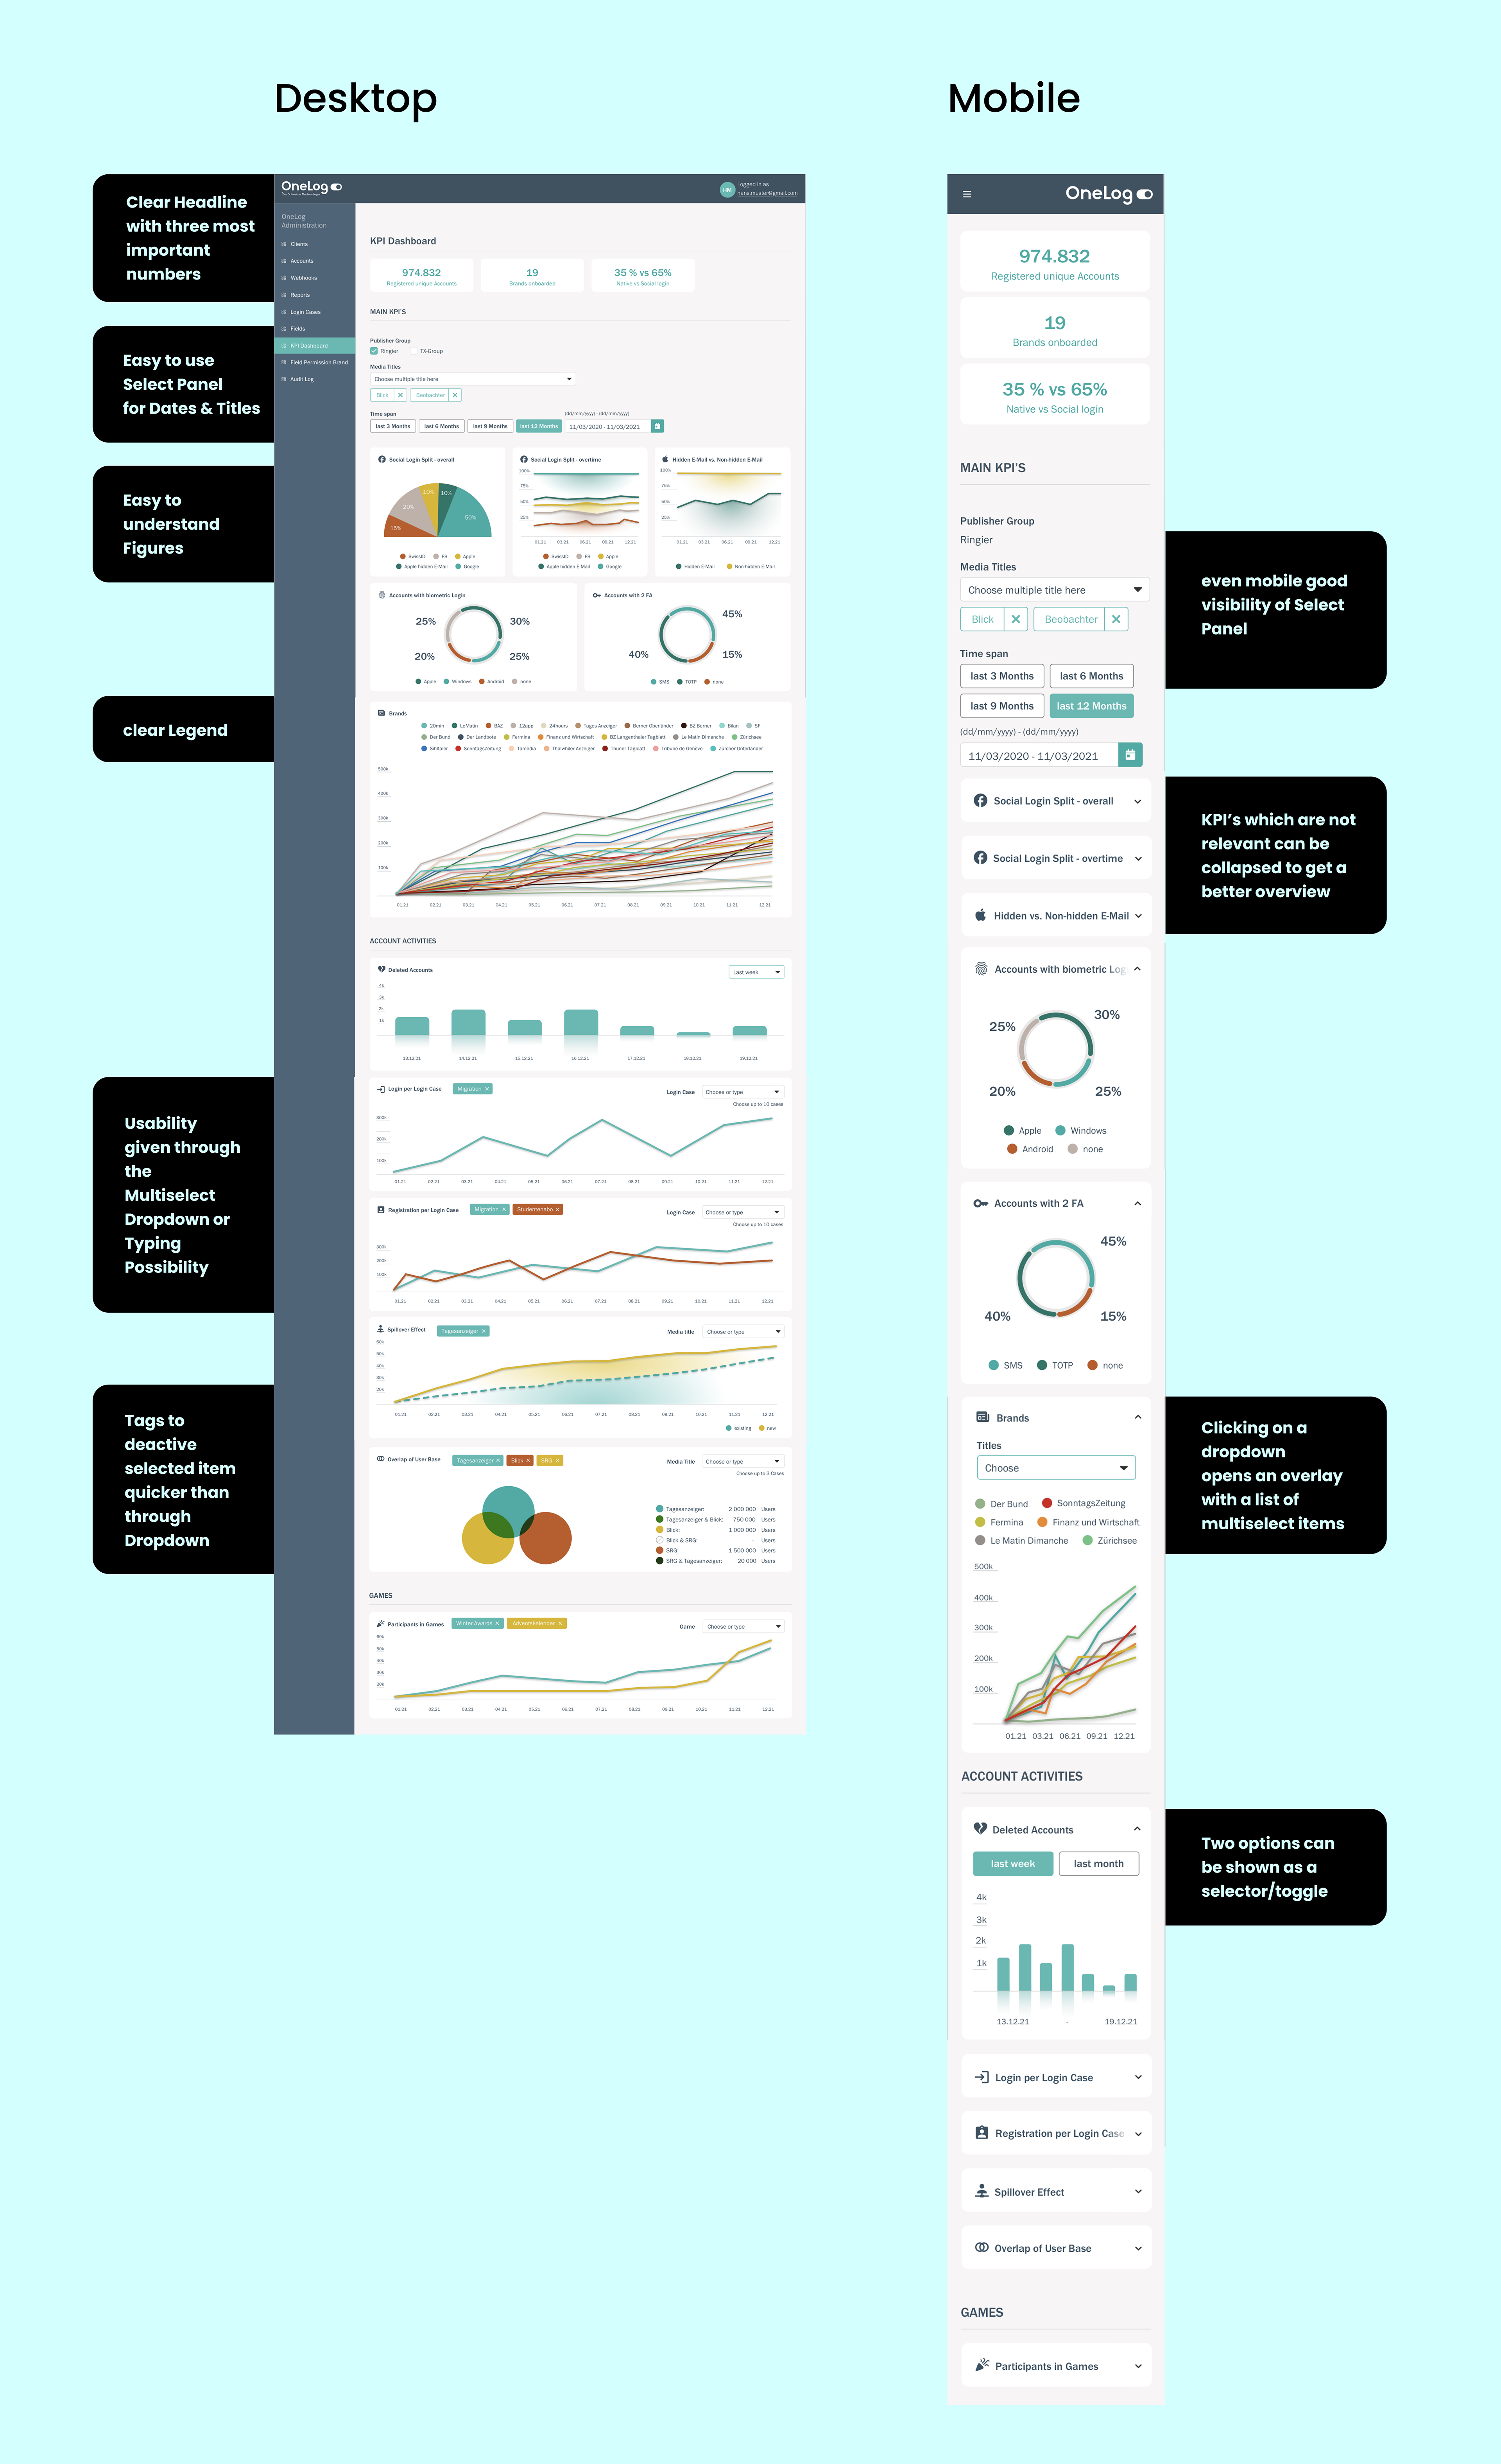
Idea Defining the most important KPIs and presenting them in an appealing way.
USP Easy to use on both a mobile and desktop device.
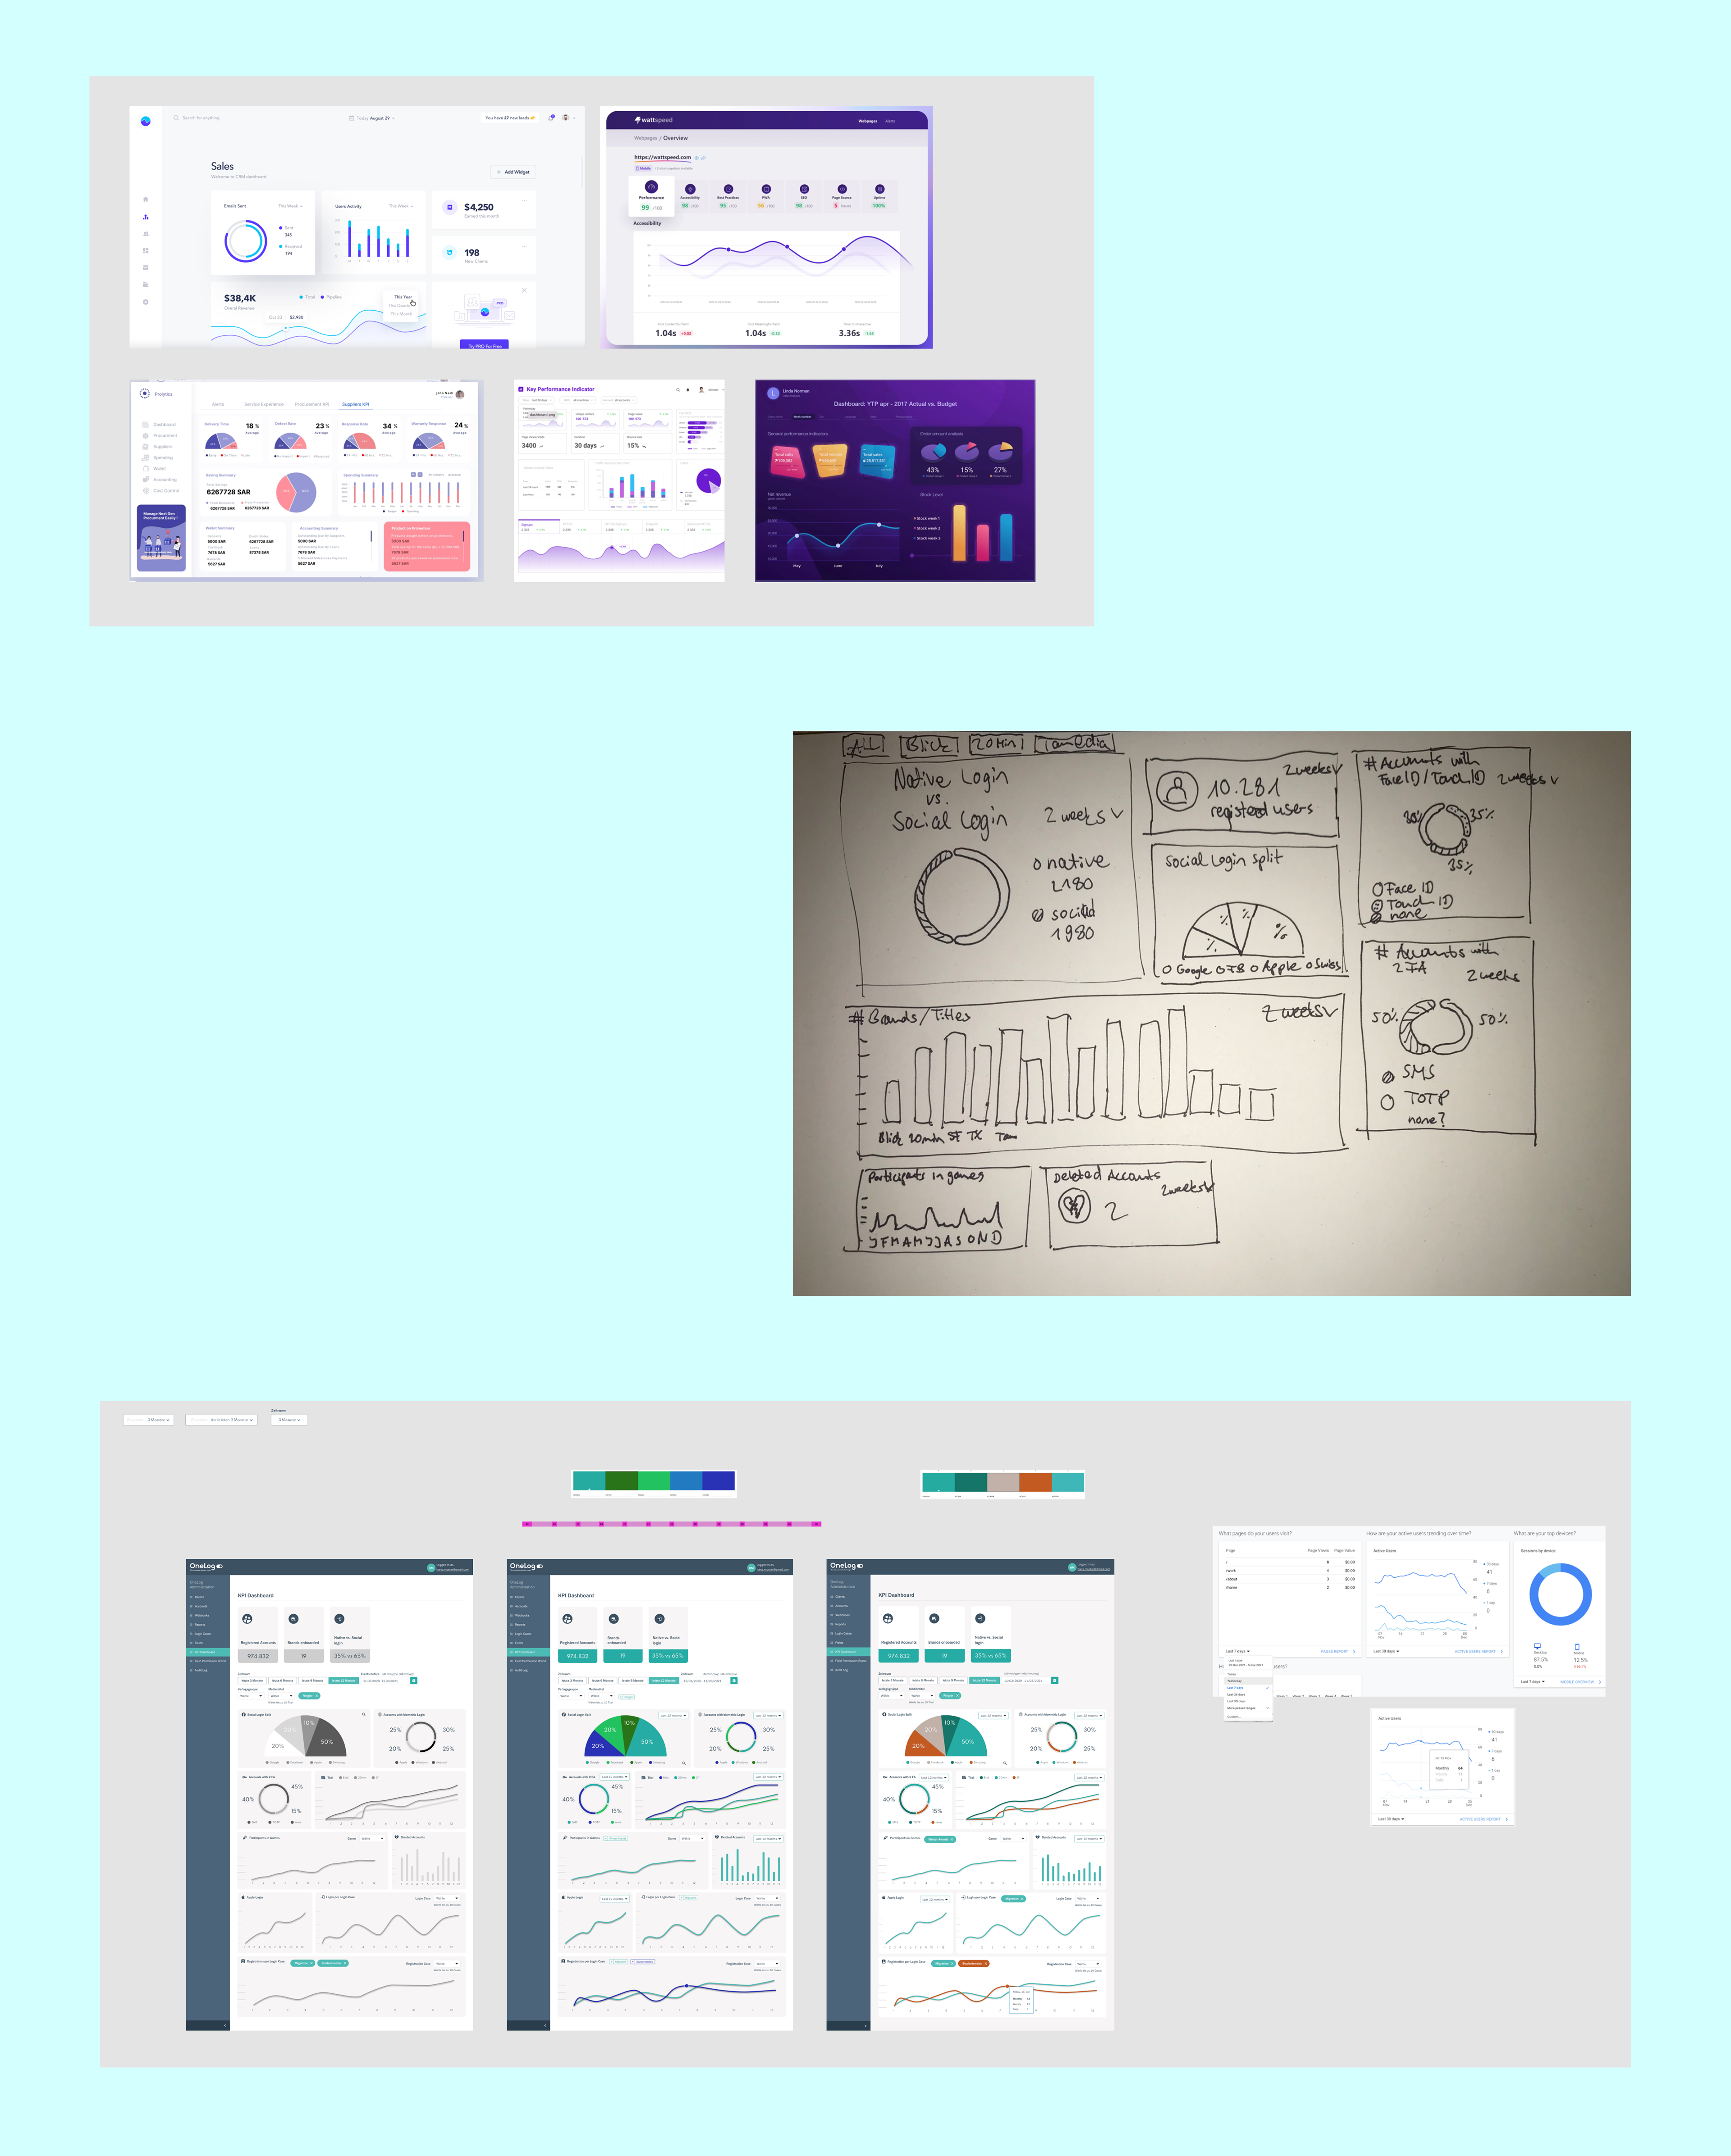
Benchmarking, Inspiration, Scribbles and
first Lo-Fi Daft
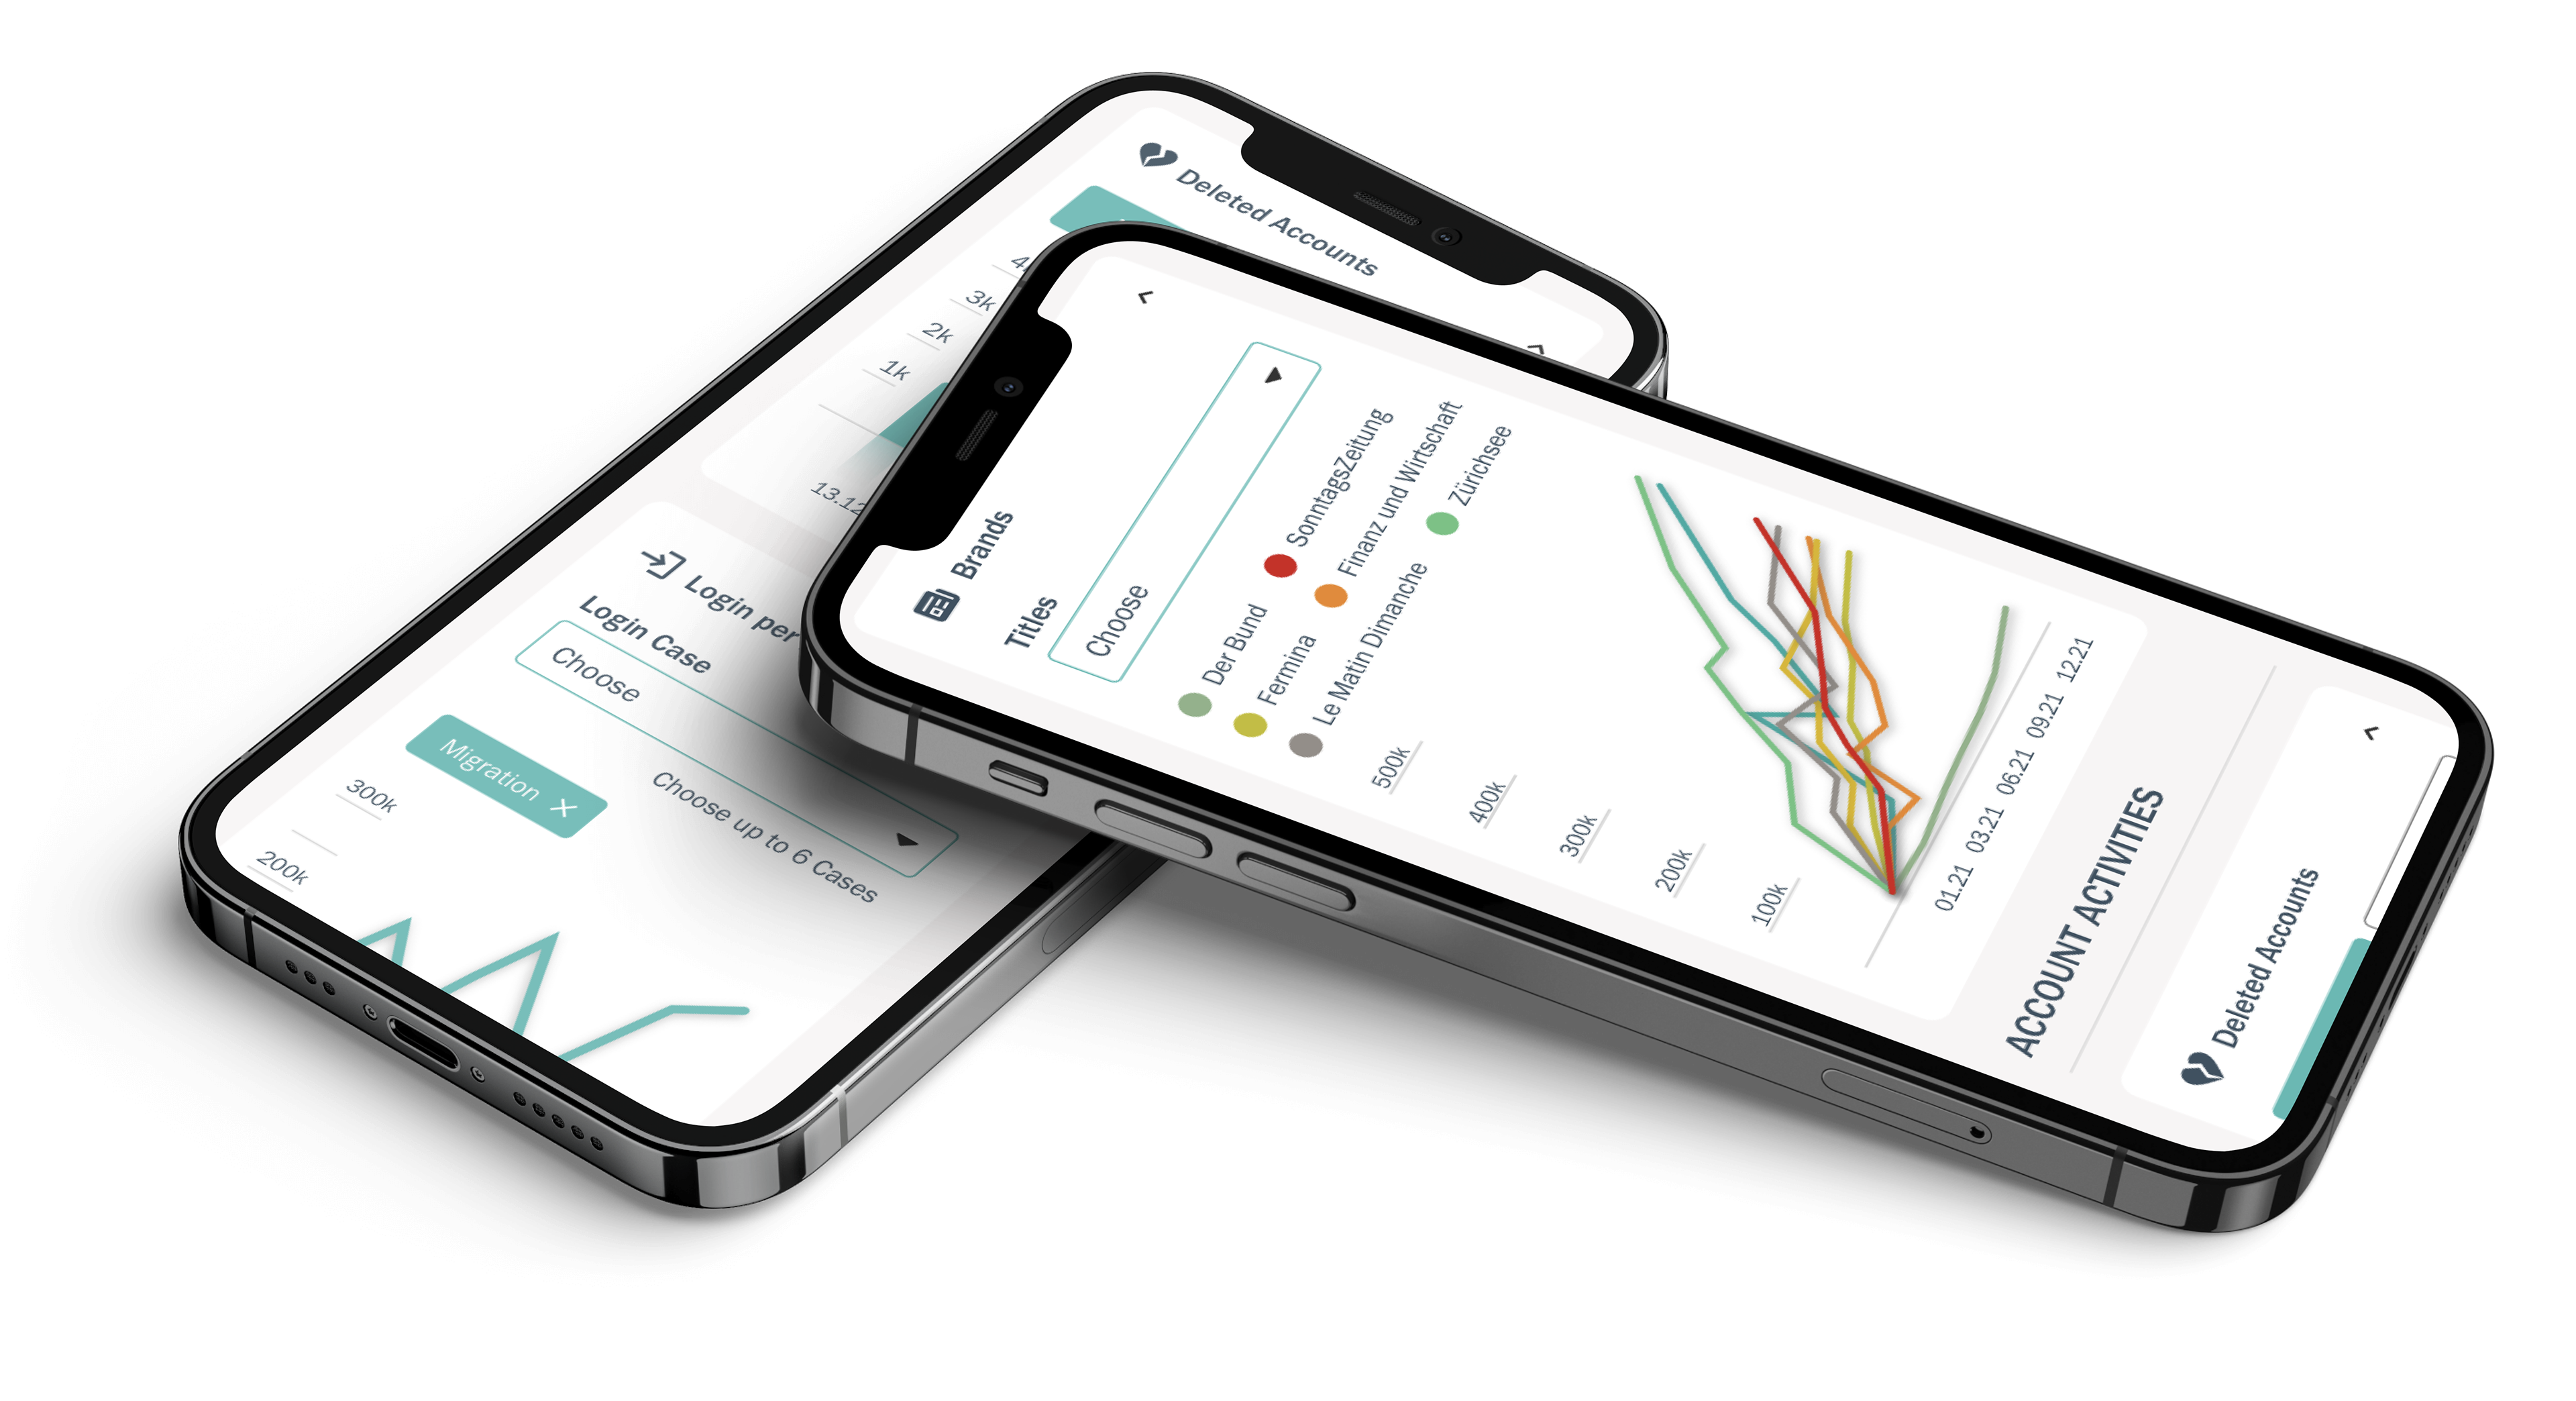
Preview mobile KPI Dashboard
Information Architecture
Extended Design System for KPI Dashboard

Tools in this Project: Sketch, Invision, Invision Freehand, Jira
Statement: I rather use Figma as a product design tool, but it was interesting to see the differences between those tools. In my point of view in Figma you design with the Interaction in mind, as it is easy to demonstrate it for developers. In Sketch or better said Invision I find it more ponderous to achieve the same result.
🧡 Let's work together 🧡
🧡 Thank you for getting in touch 🧡I will reply in less than 2 working days ✌️